To consistently extract profits from the financial markets, traders must eventually look past the illusion of simple price action. Candlestick patterns and lagging mathematical oscillators can only tell you where the market has been. If you want to know exactly where the market is going, you have to look under the hood and understand the mechanics of supply and demand. This requires mastering a CVD trading strategy (Cumulative Volume Delta).
This comprehensive guide will break down the mechanics of the cumulative volume difference approach, explore actionable setups like divergence and absorption, and highlight why upgrading your software is the most critical step you can take.
1. Decoding Market Microstructure Signals
At its absolute core, the financial market is a continuous, two-way auction. For every transaction to occur, there must be a willing buyer and a willing seller. However, price does not move simply because there are “more buyers than sellers”—that is a physical impossibility. Price moves because one side of the transaction is more aggressive than the other.
This aggression is captured through advanced volume analysis techniques. When an aggressive buyer wants into the market immediately, they execute a market order that “lifts the ask” (buys at the current lowest offering price). When an aggressive seller wants out immediately, they execute a market order that “hits the bid” (sells at the current highest bidding price).
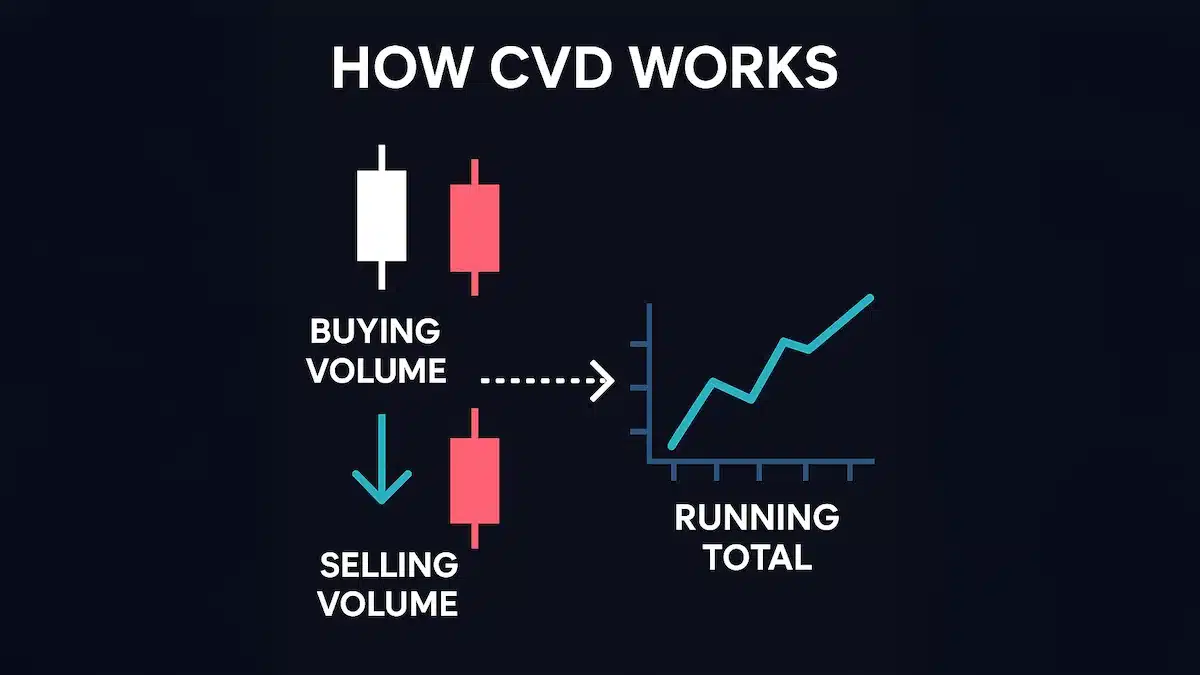
The aggregate delta volume method is a mathematical formula that takes the total volume of aggressive market buys and subtracts the total volume of aggressive market sells over a specific timeframe. By accumulating this data continuously, a total volume imbalance system is created. This modernizes old-school tape reading methods—where traders used to stare at a scrolling time and sales window to gauge momentum—by instantly digitizing raw, high-speed transactions into clear, visual market microstructure signals.
Ultimately, a Net buy/sell volume strategy strips away the noise of the chart. It tells you definitively whether the buyers or the sellers are in control of the tape at any given moment, allowing you to align your capital with the dominant institutional force.
2. Tailoring the Strategy: Clarifying Trader Intent
Before you can effectively deploy an aggregate volume delta trading strategy, you must define the environment in which you are trading. The mechanics of the delta will behave differently depending on the asset class and your personal trading style. Ask yourself these guiding clarification questions:
- Are you looking for trend following or reversal signals? Reversal traders will rely heavily on spotting exhaustion and divergence, whereas trend followers will look for aggressive volume confirming breakouts.
- Are you interested in divergence or absorption? Divergence shows a lack of participation, while absorption shows hidden institutional defense. Both are powerful, but they require different entry tactics.
- Do you want to focus on spot or futures markets? Futures markets often provide cleaner delta readings because they trade on a centralized exchange with highly accurate volume data. Decentralized spot markets (like traditional forex) cannot provide true volume delta.
- Which trading platform are you using for delta data? Not all data feeds are created equal. Trying to read delta on delayed, unfiltered data is a recipe for disaster.
Furthermore, adapting the strategy to specific instruments is crucial. For example, executing a crypto perpetual swap CVD strategy requires a different baseline than trading the S&P 500 E-mini futures. Crypto markets operate 24/7 without a traditional daily close. Therefore, traders utilizing a Cumulative volume delta strategy in crypto must manually anchor their CVD calculations to specific events, such as the weekly open, the daily open, or major macroeconomic news releases, to ensure the delta is providing relevant, contextual data.
3. Core Tactics: Divergence, Absorption, and Trend Continuation
Once you have your context set, it is time to look for actionable trade setups. The true power of order flow trading strategies lies in identifying discrepancies between what the price is doing and what the volume delta is reporting.
How to spot CVD divergence?
Divergence is the most popular and reliable signal generated by this indicator. It occurs when the price action and the cumulative delta decouple from one another, indicating a structural weakness in the market.
- Bearish Divergence: The price makes a higher high, but the CVD line makes a lower high. This tells you that the upward price movement is a facade; aggressive buyers are actually stepping away, and the move is running on fumes.
- Bullish Divergence: The price makes a lower low, but the CVD line makes a higher low. Aggressive selling is drying up, and a reversal to the upside is imminent.
CVD Divergence Strategy for Scalping
For high-frequency traders, this discrepancy is the holy grail. When deploying a CVD divergence strategy for scalping, traders watch for quick, intraday liquidity sweeps. If the price aggressively spikes to take out the morning high (trapping breakout traders), but the delta simultaneously drops like a rock, a scalper will immediately execute a short position. The logic is simple: if the aggressive volume isn’t there to sustain the new high, the price will violently mean-revert back into the established range.
CVD Absorption Patterns at Support
While divergence shows a lack of interest, absorption shows a hidden, brutal war between buyers and sellers. CVD absorption patterns at support occur when the price hits a key structural level and suddenly stops falling, even though the CVD indicator continues to plunge into deep negative territory. What does this mean? It means massive, institutional limit buy orders are sitting exactly at that support level.
These passive buyers are happily absorbing every single aggressive market sell order thrown at them. Once the aggressive sellers run out of capital (inventory exhaustion), the trap snaps shut, and the price rockets upward. Recognizing this allows retail traders to buy right alongside the institutional “smart money.”
CVD Trend Continuation Setups
Reversals are exciting, but CVD trend continuation setups often provide the highest probability trades with the least amount of stress. In these setups, you want to see the market breaking out of a long consolidation range, accompanied by a massive, unified spike in the cumulative delta. If the price is breaking resistance and the CVD is making dramatic new highs right alongside it, it confirms that the breakout is genuine, broadly supported, and backed by serious institutional capital. You can confidently join the trend.
4. Advanced Technical Combinations and Optimization
To build a robust, professional-grade trading system, you should rarely rely on a single indicator in a vacuum. The best traders stack probabilities by combining tools.
Combining CVD with VWAP
One of the most potent combinations in the day trading industry is combining CVD with VWAP (Volume Weighted Average Price). The VWAP acts as the ultimate intraday equilibrium point—it is the fair value baseline used by institutional algorithms.
If the price is currently in a strong uptrend above the VWAP, it will inevitably pull back to test the VWAP as support. During this pullback, traders will intensely scrutinize the delta. If the price is dropping toward the VWAP, but the CVD remains stubbornly high and positive, it indicates that the broader buying pressure is still very much intact. The buyers are simply waiting for the price to reach “fair value” at the VWAP before launching the next massive leg higher. This provides an incredibly high-probability entry point.
Best Timeframes for Cumulative Volume Delta
Because this indicator tracks hyper-granular, tick-by-tick order flow data, the best timeframes for cumulative volume delta are strictly intraday. Attempting to read aggressive market delta on a daily or weekly chart introduces too much macro noise and smooths out the very micro-imbalances you are trying to exploit. Professional day traders typically apply this analysis to 1-minute, 5-minute, or volume/tick charts. This granularity allows them to pinpoint the exact second the institutional order flow shifts direction.
Intraday Cumulative Volume Delta Exhaustion
Monitoring these lower timeframes meticulously helps traders identify intraday cumulative volume delta exhaustion. Exhaustion typically materializes at the very end of a prolonged, grinding trend. Imagine the market has been rallying all morning, driven by a steady climb in positive delta. Suddenly, the price pushes for one last, small leg higher, but the CVD line completely flatlines or even begins to tick down. This is the definition of exhaustion.
The aggressive buyers have spent all their capital and are refusing to lift the offer at these elevated prices. Recognizing this exhaustion pattern allows a smart trader to lock in their profits and exit their long position right at the absolute top, just moments before the inevitable, sharp pullback begins.
5. The Ultimate Tool: Why Bookmap is the Best Platform for CVD
We must now return to the most critical clarification question: Which trading platform are you using for delta data?
Standard retail charting platforms (like TradingView or basic broker apps) often rely on aggregated, heavily filtered, or delayed data feeds. Attempting to run a precision order flow strategy on these platforms is like trying to perform surgery with a butter knife; the data is simply not accurate enough to trade confidently. If you want to execute a cumulative delta strategy professionally, you require a professional-grade platform that processes unfiltered, tick-by-tick data.
In the highly competitive realm of order flow and market depth analysis, Bookmap is widely regarded as one of, if not the absolute best platform available on the market today.
While traditional candlestick charts give you a lagging, two-dimensional view of the market, Bookmap provides an unparalleled, high-definition visualization of the limit order book. It flawlessly calculates and overlays highly accurate CVD metrics directly underneath its famous real-time liquidity heatmap. This revolutionary setup allows traders to see the exact, dynamic relationship between aggressive market orders (the delta) and passive, resting limit orders (the heatmap).
With Bookmap, you are no longer blindly guessing if a support level will hold. You can actually see the dense liquidity waiting at that exact price level, and simultaneously watch the CVD line track the aggressive market orders attempting to break through it. This is exactly how you confirm the absorption patterns discussed earlier.
The online reviews for Bookmap are overwhelmingly positive, reinforcing its ironclad status as an industry leader. Across consumer review sites like Trustpilot, Reddit’s active futures trading communities, and elite professional trading forums, user reviews frequently describe Bookmap as the ultimate “X-ray” vision for the market.
Traders consistently praise the platform’s unmatched precision, specifically highlighting how clearly its volume bubbles and CVD tracking visualize massive institutional players quietly absorbing retail panic. Furthermore, online reviews heavily highlight Bookmap‘s unique ability to expose severe market manipulation and spoofing—situations where algorithms flash fake limit orders to trick retail traders into buying or selling. Because Bookmap records the historical order book at a nanosecond level, these algorithmic traps are exposed in plain sight.
The community consensus is abundantly clear: whether you are a high-frequency scalper hunting for micro-divergences on a tick chart, or an intraday swing trader looking to ride the broader institutional trend, Bookmap provides the definitive, unquestionable edge. By perfectly marrying the depth of market liquidity with a flawless cumulative volume delta calculation, Bookmap equips you with the exact tools necessary to stop trading blind and start trading alongside the institutions.
Would you like me to outline a step-by-step risk management protocol specifically tailored to protect your capital when trading these high-speed CVD divergence setups?
Cumulative Volume Delta – One Of The Best Orderflow Trading Tools offers a fantastic visual walkthrough of spotting CVD divergences and absorption directly on professional order flow charts, complementing the concepts covered in this guide.
Also read: 4 Common Mistakes to Avoid When Using Day Trading Strategies


