A fishbone diagram, known as a cause-and-effect diagram, is a visualization that presents possible causes of an issue or problem. When you are seeking for a way to root out the grounds of a problem or brainstorm problems, fishbone diagrams are good for making causes visualization to get your problems identified for rapid resolution. This tutorial will help you learn how to make a fishbone diagram with ease.
What is a Fishbone Diagram
Fishbone diagrams, also called Ishikawa diagrams, herringbone diagrams, cause-and-effect diagrams, or Fishikawa, is a type of visualization used to map out potential causes for identifying the problem. When something goes wrong, the fishbone diagram can help you display different categories for reasons and list specific causes of each category, and this makes it easier to spot the possible causes leading to an issue and figure out the relationship between cause and effect.
Depending on the concise and explicit fishbone diagram, you can find the underlying variables easily and find feasible solutions effortlessly.
How to Make a Fishbone Diagram with MindOnMap
To help you understand deeply, here we will show you how to create a fishbone diagram with a free and easy-to-use tool called MindOnMap. It is dedicated to using visual experience diagrams and maps to display and visualize your ideas effectively. Also, it is helpful to define the factors contributing to a problem, making it easier to address and overcome complex issues.
Now you can go to the official website of MindOnMap (https://www.mindonmap.com/), then hit on the Create Your Mind Map button to proceed. Now, you are required to sign in to your account. If you don’t have one, you can create an account for free. When you log in successfully, a new window will appear. Then, choose the Fishbone feature to proceed.
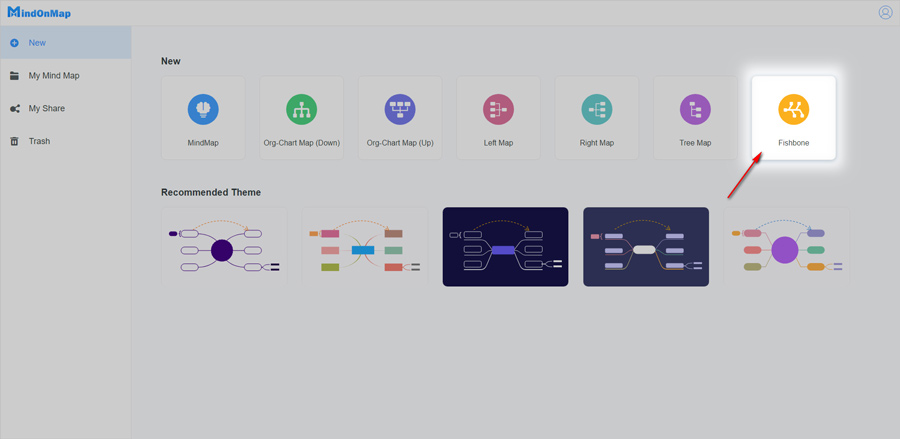
Now you can start creating your fishbone diagrams by following the steps below:
1. State the Problem
The first step to use a fishbone diagram is to state the problem or event that you’re trying to figure out what exactly it is.

2. Define the Core Categories
Now, you can consider drawing up all the main categories you can think of about your current problem to group the causes. The category could be people, procedures, process, methods, measurements, environment, machines, materials, etc. Navigate to the top menu bar; you can add nodes with the click of the Node button.

Then, add each category to the main box at the top of the fish bones, then discuss and question each one.

3. Brainstorm the Causes
After that, you should think about what factors lead to each category and try identifying as many causes as possible. To brainstorm and produce new ideas, you can use storyboarding, question assumptions, group sketching, brain netting, or other brainstorming techniques. Then, you can list the underlying causes under each category.
4. Analyze Your Results
Once you have a good and clear cognition – the relationship between cause and effect to work from, you can start uncovering the actual root cause of a problem.
5. Export and Share Your Fishbone Diagram
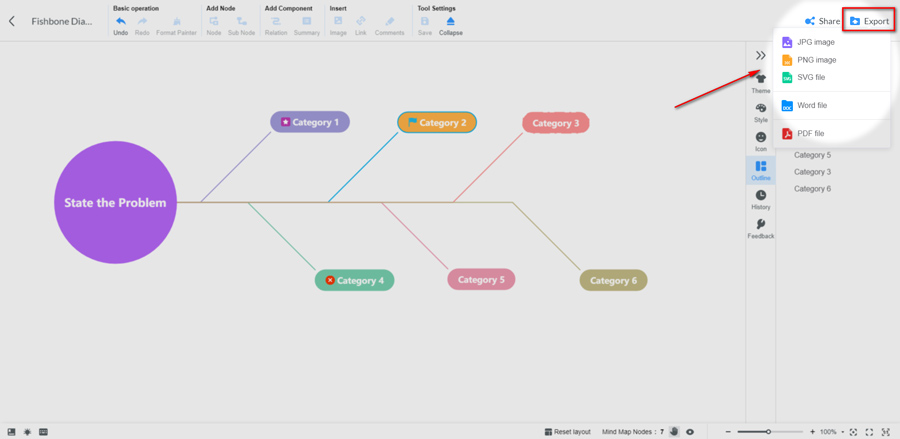
When the diagram is complete, you can export it by clicking the Export button at the top right corner.

It allows you to save the fishbone in JPG, PNG, SVG, Word, or PDF format. Aside from that, you can share a link using the Share function.
How to Customize the Fishbone Diagram
While making the fishbone diagram, here are some techniques to enrich and customize your own fishbone diagrams.
Use a Theme
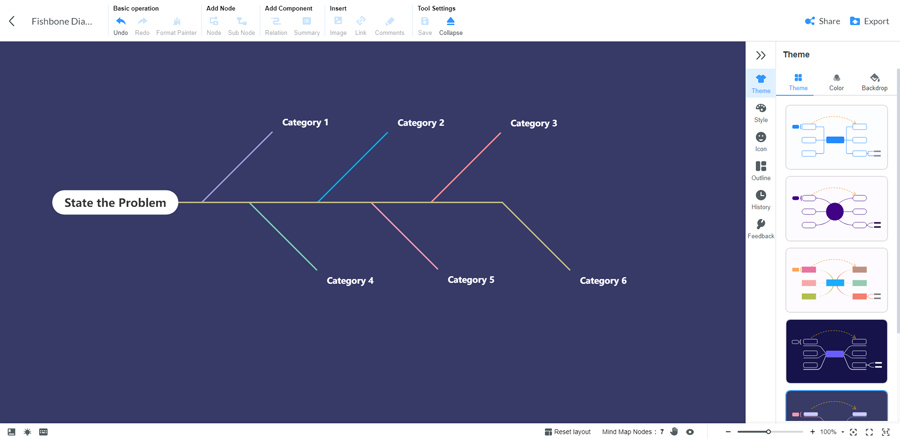
To make your fishbone diagram memorable, a sound mind map theme could inspire more ideas and make them stick. In MindOnMap, you can choose your desired theme from the right pane. Click the Theme option to unfold the list of options on the right, then select a proper theme that suits your topic most.
Add a Custom Node Style
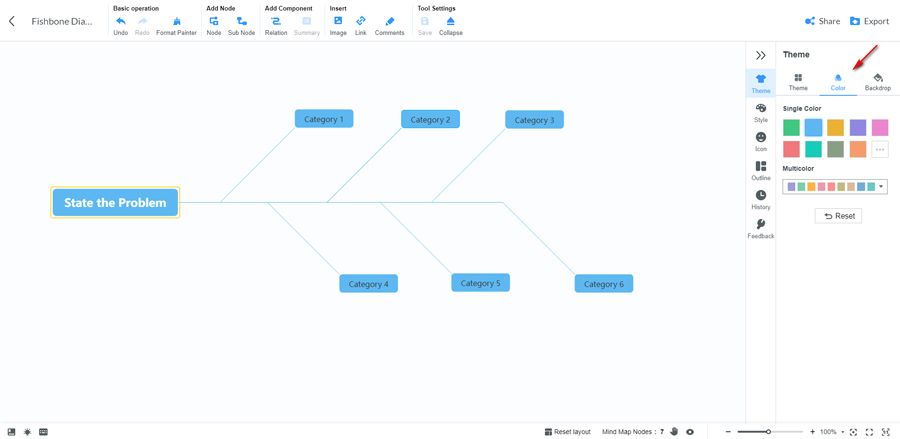
MindOnMap allows you to stylize every aspect of the node, including line width, line color, line style, shape style, etc. A custom node could help you visualize your thoughts and ideas effectively.

Also, you can fill in a single color or multicolor to your fishbone diagram based on your needs.
Apply Icons
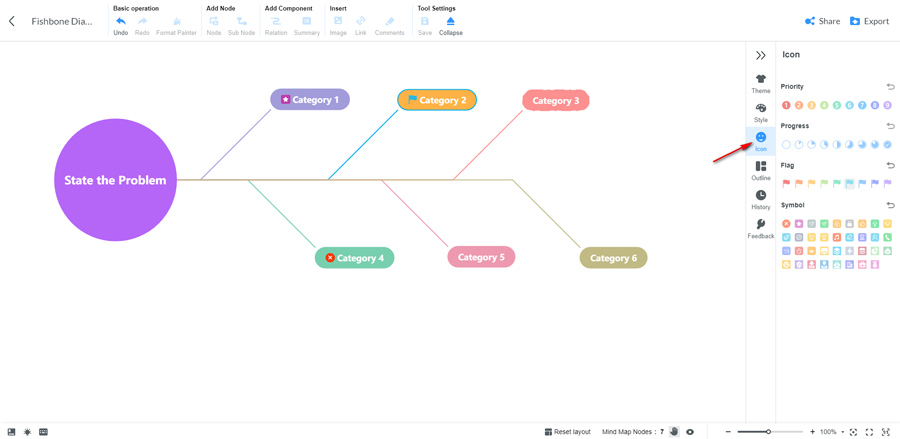
To distinguish the emphasis of each category or cause, MindOnMap offers different functional icons to show the priority, progress, attribute, etc.
Conclusion
While reaching the root cause of problems is a tough job, fishbone diagrams can be very useful for visualizing problems and causes. In this case, using a relatively simple fishbone diagram maker just like MindOnMap to explore the latent factors of a particular event or issue can help you get started easily.
Also read: How Online Tutoring Help Students Better Their Learning


